
Assortment planning in Apparel: the gaps your style-level reports can't see
Style-level assortment reports hide the attribute gaps that actually decide sell-through. Here's how to find them and what the data has to look like first.

A bottoms buyer looks at a style-level report and sees the category is up 6% against last year. The reorder decision is easy: chase the winners, cut the bottom quartile, repeat the plan. Nothing in that report tells her that every winning style happens to sit in the same three attribute values, or that a whole combination of fit, wash, and inseam that customers keep buying somewhere else in the market simply doesn't exist in her line. Style-level reporting rolls up performance by product ID. It was never built to show structure. And structure, not style rank, is what an assortment actually is.
The style number hides the decision that matters
A style number is a bundle of attributes wearing a single SKU-like disguise. "Style 4021" is really fit + inseam + wash + rise + price band + fabric, collapsed into one row so a report can sort it. When you rank by style, you learn which bundles worked. You learn nothing about which attribute combinations were never tested, which ones are quietly over-built, and where the line has a hole shaped exactly like unmet demand. Fashion retail's own academic literature on assortment planning has been making this point for a long time: classic assortment-planning research treats a fashion line as a set of attribute levels to be combined and evaluated, not a flat list of items ranked by units sold (see the foundational ScienceDirect paper on assortment planning in fashion retailing). The theory has always been attribute-first. Most planning tools, and most of the reports built on top of them, are still style-first.
That mismatch produces three recurring failure modes in apparel assortments:
- White space: an attribute combination with real demand signal, evidenced by sell-through on adjacent values or a competitor's bestseller, that the current line simply does not carry.
- Over-assortment: too many SKUs stacked into one attribute cell, cannibalizing each other's sell-through and tying up open-to-buy that could fund a gap elsewhere.
- Break points: the line changes abruptly between two adjacent attribute values (say a jump from a 9-inch inseam straight to a 13-inch, with nothing at 11), when the actual demand curve is smooth and a size or length in between is where the volume sits.
None of these show up in a style ranking. All three show up the moment you plot the catalog by attribute instead of by style.
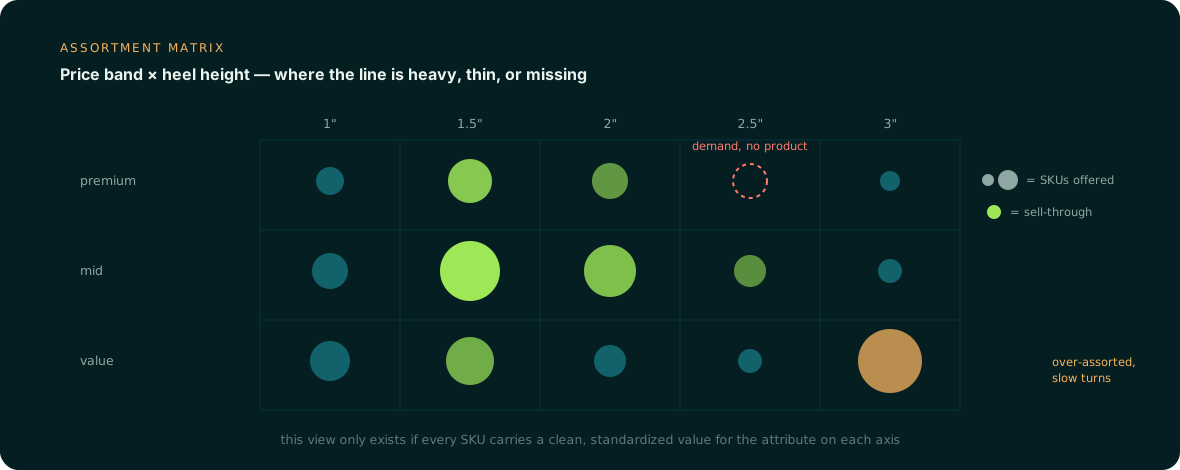
A worked example: one clean column changes the line
Take a women's bottoms category with roughly 220 SKUs across four fits (skinny, straight, wide-leg, flare), three inseam lengths (cropped, ankle, full), and four wash tones (light, medium, dark, black), sold across three price bands. Plot SKU count and sell-through across just two of those attributes, fit and wash, inside each price band, and two things jump out immediately.
| Fit x wash (mid price band) | SKUs offered | Sell-through |
|---|---|---|
| Skinny, medium wash | 14 | 31% |
| Skinny, dark wash | 11 | 34% |
| Straight, medium wash | 9 | 58% |
| Wide-leg, dark wash | 2 | 71% |
| Wide-leg, cropped, dark wash | 0 | n/a |
Skinny in medium and dark wash is over-assorted: 25 combined SKUs, sell-through in the low 30s, and heavy end-of-season markdown exposure. Straight in medium wash is a quiet outperformer that's been under-fed for two seasons. And wide-leg cropped in dark wash doesn't exist in the line at all, despite wide-leg full-length in dark wash selling at 71% and cropped lengths performing well in every other fit. That's the empty cell in the matrix above, sitting right next to strong signal on two of its three attribute values. A style-level report would tell the buyer "cut the bottom-quartile skinny styles." An attribute-level view tells her exactly which combination to cut, and exactly which combination to build next, before the line is locked.
That's the shift the Parker Avery Group's assortment planning guide points at when it argues attribute-based assortment planning has become "vital across all retail sectors," not just fashion, and that "data quality and clean hierarchies are foundational to any successful planning initiative." White space analysis of this kind, mapping demand against local and competitive gaps rather than assuming last year's mix repeats, is exactly the practice retail strategists describe when they talk about finding untapped growth inside an existing assortment instead of chasing entirely new categories.
What has to be true of the data before any of this works
The matrix only tells the truth if three things are true of the attribute data underneath it.
Fill: every SKU needs the attribute populated, not just the ones a merchandiser bothered to tag well. A wash or inseam field that's empty on 20% of the catalog doesn't create 20% missing dots on the matrix, it silently misallocates those SKUs into whichever cell the report defaults them to, understating both the over-assorted cell and the gap next to it.
Standardization: "cropped," "crop," "7/8," and "ankle length" need to resolve to one controlled value, or the same physical garment splits across four cells and every one of them looks smaller and less significant than it is. Free-text attribute fields are the single biggest reason attribute-level assortment analysis gets abandoned after one attempt; the matrix looks noisy not because the market is noisy but because the taxonomy isn't controlled.
Correctness: the value has to match the actual garment, not the merchandising copy or a legacy ERP default. An inseam pulled from a tech pack spec measurement is trustworthy. An inseam inferred from a marketing description or copied forward from a prior season's similar style is not, and it will quietly misplace SKUs on exactly the break points that matter most.
Getting there without a rip-and-replace project
None of this requires a new planning system. It requires the attribute layer underneath the PIM, ERP, or spreadsheet a team already plans from to actually hold complete, standardized, correct values, extracted from the tech packs, spec sheets, and imagery that already describe every style, and flagged rather than silently overwritten when two source documents disagree on a measurement. That's a data problem, not a forecasting problem, and it's solvable independent of whichever planning tool sits downstream.
This is the same argument underneath demand forecasting generally: a forecast is an aggregation, and attributes are the dimensions it aggregates along. Get the fill, standardization, and correctness of those attributes right first, and the same style-level report that used to hide the gap starts showing exactly where the line is thin, where it's bloated, and where the next best-seller is waiting in a cell nobody's filled yet.