
Assortment planning in Footwear: the gaps your style-level reports can't see
Style-level assortment reviews hide the attribute-level gaps in footwear lines. Here's how to see white space, over-assortment, and break points before you buy.
A style-level assortment review tells you sneakers sold better than boots this year. It will not tell you that your suede booties between $100 and $160 are propping up a stalling segment while a knit-sneaker price point one tier up has no offer at all and would probably sell. That second fact only shows up when you cut the line by attribute, not by style number, and most planning reviews never make that cut because the attribute data underneath isn't clean enough to cut by.
Footwear brands and retailers already know silhouette mix is shifting. Boot share of the market fell from 17% in 2021 to 7% in 2025, with buyers rotating toward sneakers, flats, and sandals, according to JOOR's footwear market analysis. That's a silhouette-level signal, and most assortment tools can see it because silhouette is usually a clean, well-populated field. The problem is everything one level down: upper material, closure type, heel height, outsole construction, toe shape. Those are the attributes that actually explain why one boot sells and its near-identical neighbor sits at 40% markdown, and they're also the attributes most likely to be missing, inconsistent, or buried in a free-text description nobody queries.
Why style-level rollups flatten the decision
A style-level report answers "which styles worked." An assortment decision needs "which combination of price point, material, and construction worked, and where is that combination missing." Those are different questions, and the gap between them has a name in retail analytics: white space, the untapped combinations of demand and offer that a line-by-style view can't surface because it never groups product any way other than by style, as ki-value's guide to white space analysis frames it for mid-size fashion retailers.
Three failure modes hide inside a clean-looking style-level report:
- White space: an attribute combination customers want, adjacent segments prove it, and the line offers zero SKUs there.
- Over-assortment: too many SKUs stacked into one attribute cell relative to what it actually sells, usually because it's easy to line-extend a familiar combination rather than test a new one.
- Break points: the price or size point where sell-through falls off a cliff for one attribute value but not its neighbor, which tells you where the next markdown or the next price test should land.
None of these are visible in a spreadsheet organized by style number and season. They only become visible once every SKU carries clean, comparable values for the attributes that actually drive fit and preference in footwear: upper material, closure, heel height band, width, outsole type.
A worked example
Take a hypothetical women's footwear brand reviewing its fall line across four price bands and five upper materials. Once the attribute columns are clean, the same sales and inventory data that fed the style-level report can be re-cut like this:
| Price band | Upper material | SKUs offered | Sell-through |
|---|---|---|---|
| Value (under $60) | Canvas | 6 | 71% |
| Mid ($60-$100) | Suede | 14 | 38% |
| Mid ($60-$100) | Knit | 3 | 68% |
| Premium ($100-$160) | Suede | 9 | 22% |
| Premium ($100-$160) | Knit | 0 | — |
| Luxury ($160+) | Leather | 5 | 61% |
Three things jump out that a style-level view would never show. Mid-tier suede is over-assorted: 14 SKUs chasing a 38% sell-through rate, more depth than the demand supports. Premium knit is a hole: zero SKUs, and the adjacent knit cell one tier down is selling at 68%, plus the value canvas cell shows the same customer will pay for a soft, casual upper. And there's a break point at $100 for suede specifically: sell-through drops from 38% to 22% crossing that price line, while knit doesn't show the same cliff. That's a materially different signal than "boots are down," and it's the kind of signal a buyer can act on in a line review, not just report on afterward.
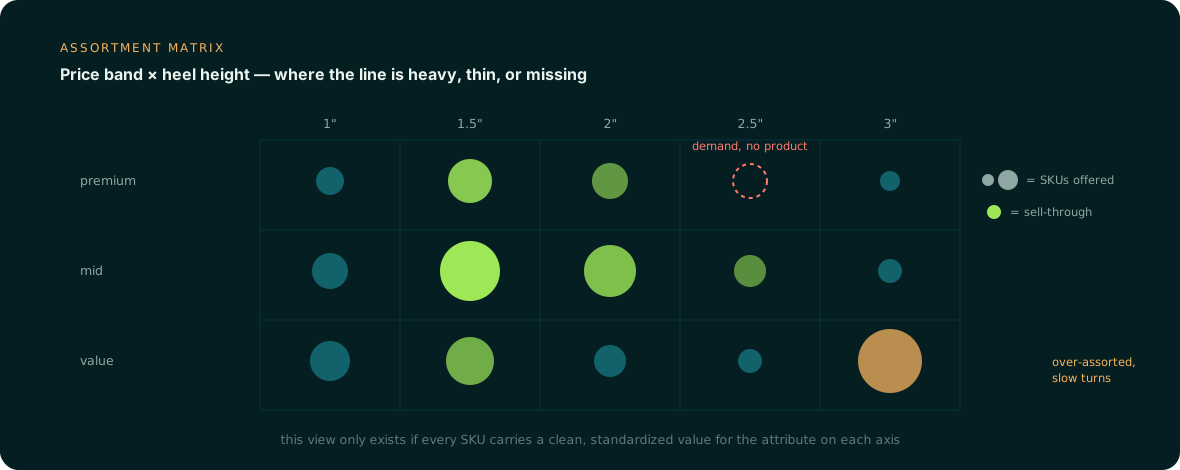
What has to be true of the data first
None of that matrix is possible if the upper material field is 30% blank, or if it's populated with whatever a merchandiser typed into a free-text description last season. Three things have to hold before an attribute cut is trustworthy:
Fill. Every SKU needs a value in the field you're cutting by, not just the SKUs someone remembered to tag. Gaps usually cluster in exactly the styles a buyer most needs visibility into: new vendors, private label, or anything migrated from a legacy ERP field that was never mapped cleanly.
Standardization. "Suede," "genuine suede," "pigskin suede," and "suede leather" have to collapse to one canonical value before a matrix means anything. Left alone, a five-value attribute quietly becomes twelve near-duplicate strings, and a pivot table splits what should be one cell into four half-empty ones.
Correctness. A tech pack says suede, a product photo shows what looks like smooth leather, and a legacy field says "leather - suede." Those need to be reconciled and flagged when they conflict, not silently defaulted to whichever source loaded last. An attribute that's wrong is worse than an attribute that's blank, because a blank gets your attention and a wrong value doesn't.
Getting there by hand is roughly what it's always been: someone opening tech packs, spec sheets, and product photography one SKU at a time, at somewhere around 30-45 minutes per SKU by typical manual-enrichment benchmarks. For a footwear line running a few thousand active SKUs across upper material, closure, heel height, and width, that's not a task a planning team does before a line review. It's a task that gets skipped, which is exactly why the attribute-level view doesn't exist yet in most assortment processes.
This is the layer Anglera works on. It plugs into whatever PIM, ERP, or flat CSV export already holds the style and SKU data — style number and SKU is enough of a join key to start — and extracts, standardizes, and validates the attributes underneath the SKU: pulling upper material and construction detail from tech packs and imagery, flagging conflicts across sources instead of overwriting them, and backfilling a new attribute like closure type or heel height band across a full catalog in about a day rather than a season. Forecasting and assortment tools can only aggregate along the dimensions the catalog actually has clean values for. Anglera doesn't replace the planning system doing that aggregation — it's the reason the dimensions underneath it are worth aggregating on.