
Assortment planning in Furniture & Home: the gaps your style-level reports can't see
Style-level sofa reports hide the attribute breaks that actually drive furniture demand. Here's how to see the white space and fix the data underneath.

A merchandising team at a mid-size furniture retailer pulls up the quarterly sectional report. Style 4410 is a top performer. Style 4410 stays in the line. That's the whole analysis, because that's the level the report was built at. Nobody asks why 4410 sells and 4180 doesn't, because the report can't see inside a style. It sees a name and a sales number, not the seat depth, fill type, or fabric performance rating that actually explains the gap.
That's the problem with assortment planning built on style-level or even SKU-level rollups in furniture and home. A "style" is really a bundle of attribute values, and different bundles perform wildly differently even within the same style name. Two sectionals with the same silhouette but different cushion fill can have a 15-point difference in sell-through, and a style-level report averages them into one number that describes neither.
What a rollup actually hides
Furniture has more attribute depth than almost any other retail category: frame material, cushion fill (foam density, down blend, fiber wrap), fabric or leather grade, performance/cleanability rating, seat depth, arm style, finish, and dimensional footprint, often stacked on a single SKU. When those attributes live as free text in a PDM export ("performance fabric," "easy-clean," "stain-resistant" all meaning roughly the same thing, entered by three different vendors) or are simply missing for a third of the catalog, a planning system can't group by them. It can only group by category and style name. So it reports what it can see, and what it can see is coarser than the thing driving demand.
This is not a new insight in assortment theory. Marshall Fisher and Ramnath Vaidyanathan's widely cited demand estimation procedure for retail assortment optimization treats a SKU as a bundle of attribute levels and estimates the demand share of each level separately, then reconstructs SKU-level demand from the combination. The method exists because attribute-level demand shares are more stable and more explanatory than SKU-level sales history alone, especially in categories with heavy variation like furniture. The practical version of that idea, for a merchandising team without a demand-science group, is simpler: build the report at the attribute-value level before you build it at the style level.
The gaps a style report can't show
Three patterns hide inside a style-level furniture report, and they matter for different reasons.
White space is demand that exists at the attribute level with no SKU offered against it. If performance fabric sells well across price bands 500-900 and 1300-1800 but the line has nothing in performance fabric between 900 and 1300, that's an open gap, not a soft category. A style-level report shows "sofas" trending fine and never surfaces the hole.
Over-assortment is the mirror image: too many near-identical SKUs stacked in one attribute cell, cannibalizing each other's sell-through while adjacent cells sit empty. Toolio's assortment planning guide frames this as the breadth-versus-depth tradeoff, and furniture lines chronically over-invest depth in whichever cushion fill or fabric family the buyer trusts, leaving true white space unaddressed elsewhere.
Break points are the sharpest and least visible pattern. Demand often doesn't decline smoothly across an attribute range, it steps down at a specific value. Seat depth might perform identically at 21 and 22 inches, then drop hard at 24, because that's where a sofa stops reading as compact for smaller rooms. If the attribute is stored as a rounded bucket ("deep seating" vs. "standard") instead of the actual inch value, the break point disappears into the bucket and the line keeps assorting past the point where demand actually stops.
One worked example
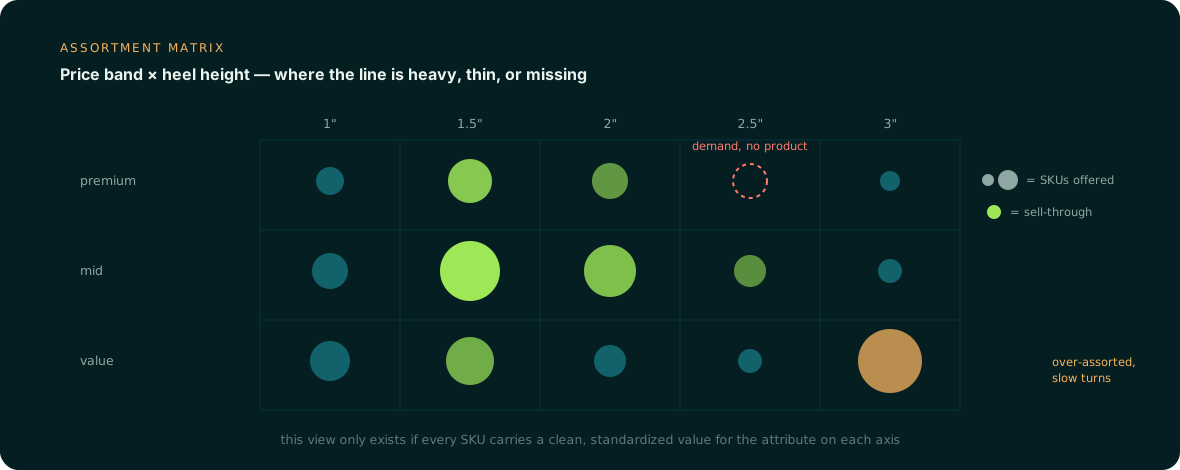
Take a sectional program with three live attributes: fabric performance tier (basic, performance, premium performance), seat depth (20, 22, 24, 26 inches), and price band. Once those attributes are clean and every SKU is correctly tagged, plot sell-through against SKU count in each price-band by attribute-value cell.
| Price band | Attribute value | SKUs offered | Sell-through |
|---|---|---|---|
| $900-1,300 | Basic fabric | 6 | 38% |
| $900-1,300 | Performance fabric | 0 | — |
| $1,300-1,800 | Performance fabric | 5 | 71% |
| $1,800+ | Premium performance | 4 | 33% |
The pattern reads instantly once it's laid out this way. Performance fabric is the strongest cell in the whole matrix wherever it's offered, but it's entirely absent in the $900-1,300 band, which is exactly where a value-conscious performance-fabric buyer would look first. Meanwhile premium performance above $1,800 is over-assorted relative to its sell-through, likely because someone liked the margin, not because demand asked for four SKUs there. The line decision writes itself: add one or two performance-fabric sectionals in the $900-1,300 band, cut the weakest premium SKU, and hold basic fabric flat. None of that is visible from a style-level report, and all of it depends on seat depth, fabric tier, and price being clean, standardized, and correctly attached to every SKU before the matrix gets built.
What the data has to be first
Attribute-level assortment analysis only works if three conditions hold. Fill: every SKU carries a value for the attributes the matrix is built on, not just the flagship items with tidy tech packs. Standardization: "performance fabric," "easy-clean," and "stain-resistant" collapse to one controlled value instead of three, and seat depth is stored as a number, not a bucket. Correctness: the value on file matches what the product actually is, not what a vendor's spec sheet claimed six SKU generations ago.
Getting there by hand is the reason most furniture catalogs never reach attribute-level planning. Manual enrichment runs somewhere around 30-45 minutes per SKU once you count spec-sheet review, image inspection, and cross-checking against vendor claims, and furniture catalogs run thick with exactly those source types: tech packs, fabric performance certs, dimensional drawings, assembly instructions. This is the layer Anglera works on. It extracts and normalizes attributes like fabric tier, fill type, and seat depth from tech packs, spec sheets, and product imagery, validates them against multiple sources and flags conflicts instead of guessing, and fills the gaps across a catalog without requiring a rip-and-replace of the PIM or planning system already in place. A clean attribute layer doesn't tell a merchandising team what to buy. It just makes sure the report they're buying against is describing the line they actually sell.