
Assortment planning in Consumer Electronics: the gaps your style-level reports can't see
Style-level assortment reports hide the attribute gaps in consumer electronics lines. Here's how to find white space, over-assortment, and break points.
A planner looking at a consumer electronics line by style number sees a clean table: 40 SKUs, sales by unit, margin by unit, done. What that table cannot show is the shape of the line underneath it. Portable speakers, soundbars, and headphones aren't really 40 independent items. They're 40 points scattered across a handful of attribute dimensions: price, IP rating, battery life, wattage, driver size, connectivity standard. The rollup by style hides where those points cluster and where they don't, and that's exactly where the next planning decision lives.
This isn't a niche problem. Fisher and Vaidyanathan's demand estimation work, built specifically for assortment optimization and later implemented at retailers including tire and auto-parts chains, models a SKU as a bundle of attribute values and estimates demand share for each value independently, then multiplies them to forecast an item that doesn't exist yet in the assortment (Fisher and Vaidyanathan, NYU Stern). The whole method only works if the attribute values on every SKU are complete and consistent enough to aggregate. A style-level view was never built to answer "how is demand for IPX7-rated speakers trending against IPX4," because style-level views don't have an IP-rating column at all, or they have five spellings of it.
Three things a SKU roll-up can't show you
White space. Demand exists at an attribute value the line doesn't carry. Search and marketplace signal show steady interest in a combination, but no SKU in the assortment sits there.
Over-assortment. Too many SKUs are stacked on one attribute value with little to differentiate them, cannibalizing each other's sell-through and consuming markdown budget that could fund something else.
Break points. Two adjacent attribute values behave completely differently even though they look like a natural progression on a spec sheet. A jump from 6-hour to 10-hour battery life might not move units, while 10 to 20 hours might be the point buyers actually pay for. You can't see a break point in a style list. You can only see it once battery life exists as its own column you can group by.
None of this is visible until the attribute is its own field, cleanly filled and standardized across every SKU, sitting next to price and sell-through in the same table.
A worked example: portable Bluetooth speakers by IP rating
Take a mid-market portable speaker line, 60 SKUs, sold through a mix of owned e-commerce and marketplace. The planner wants to know where to invest for next season. Style-level reporting says: three of the top five sellers are speakers, margins are fine, ship more of what's working.
Pull IP rating (water and dust resistance) into its own attribute column, standardized to the actual test rating rather than marketing copy, and cross it with price band. A different picture appears.
| Price band | IPX4 (splash) | IPX5 (jet spray) | IPX7 (submersible) | IP67 (dust + submersible) |
|---|---|---|---|---|
| $30-50 | 9 SKUs, sell-through 61% | 3 SKUs, sell-through 54% | 2 SKUs, sell-through 58% | 0 SKUs |
| $50-80 | 6 SKUs, sell-through 48% | 4 SKUs, sell-through 51% | 12 SKUs, sell-through 22% | 1 SKU, sell-through 40% |
| $80-120 | 2 SKUs, sell-through 44% | 0 SKUs | 3 SKUs, sell-through 71% | 0 SKUs |
| $120-200 | 0 SKUs | 1 SKU, sell-through 63% | 4 SKUs, sell-through 68% | 2 SKUs, sell-through 66% |
Three things jump out that no style-level report would surface. The $50-80 / IPX7 cell is carrying 12 SKUs at 22% sell-through, roughly a third of the whole line's unit count sitting in the weakest-performing cell. That's over-assortment: too many near-duplicate submersible speakers fighting for the same shelf space and the same shopper. Meanwhile $80-120 / IPX5 is empty, even though IPX5 performs respectably in every other band and the $80-120 tier sells well at IPX7. That's white space: a plausible, adjacent gap the line has simply never tested. And the jump from IPX4 to IPX5 barely moves sell-through in any price band, while the jump to IPX7 does, in every band except the over-assorted one. That's a break point: the attribute value that actually earns a price premium isn't the one halfway up the spec sheet, it's the one two steps up.
None of that shows up until IP rating exists as a clean, standardized attribute on every SKU, not a phrase buried in a bullet-point description that might read "IPX7," "IP-7 waterproof," "submersible up to 1m," or nothing at all.
What has to be true of the data before this analysis works
Three conditions, and all three usually fail at once in a real electronics catalog:
Fill. Every SKU needs a value in the attribute you're grouping by. If IP rating is populated on 70% of the line and blank on the rest, those blank rows either disappear from the analysis or, worse, get silently bucketed as "none" and make an entire price band look weaker than it is.
Standardization. The values that are present need to map to a shared, finite set. "Water resistant," "splash-proof," "IPX4 rated," and "IPX4" have to collapse to one value before a group-by means anything. Free text doesn't aggregate; it just sits there looking like data.
Correctness. A rating pulled from marketing copy isn't the same as a rating pulled from the actual spec sheet or test certificate. Overstated or understated attribute values don't just mislead a shopper on a PDP, they mislead the rollup a planner is staring at, because the model can't tell a confident wrong value from a confident right one.
Getting there usually means going back to the actual source documents, tech packs, spec sheets, certification records, and product imagery, rather than trusting whatever free-text description made it into the catalog first. That's slower manual work at scale (enrichment teams commonly cite something in the range of 30-45 minutes per SKU for this kind of attribute correction done by hand), which is precisely why most catalogs never get past style-level reporting in the first place. Retailers and brands who've automated attribute extraction and validation from those same source documents can backfill a rating like IP class across thousands of SKUs in about a day, then keep it current as new products land, rather than treating it as a one-time cleanup project that decays again within a quarter.
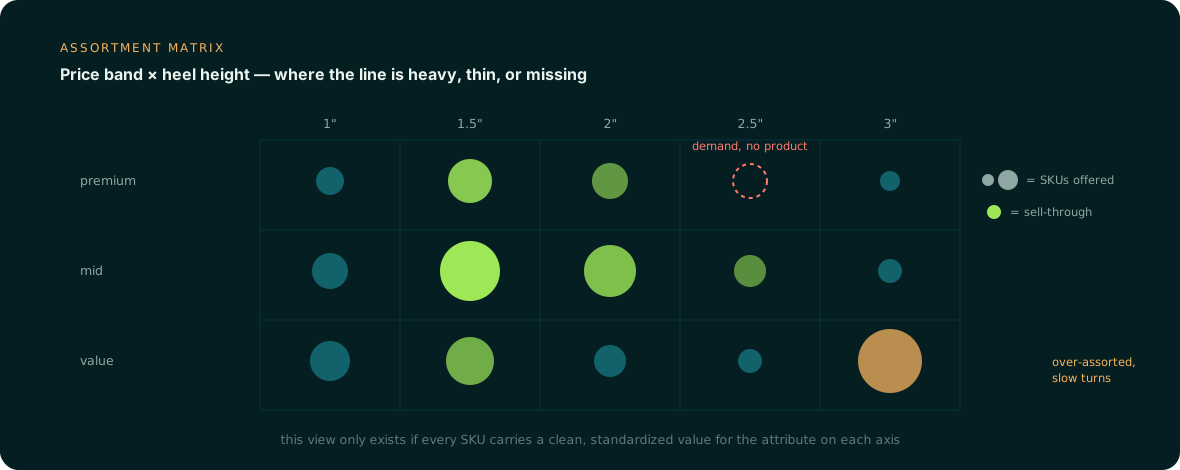
The forecast, the assortment matrix, and the like-item substitution logic in your planning system are all aggregations. Attributes are the dimensions they aggregate along, and a wrong or missing value doesn't just cost you one SKU, it quietly bends every rollup built on top of it. Anglera doesn't replace the PIM or the planning tool doing that aggregating; it's the layer that goes back to source documents and imagery, extracts and standardizes the attribute values underneath the SKUs, flags what conflicts instead of guessing, and keeps that foundation current, so the matrix a planner builds on top of it actually reflects the line.