
Assortment planning in Sporting Goods: the gaps your style-level reports can't see
Style-level sell-through hides the assortment gaps that matter. How sporting goods planners find white space using clean attribute data, not SKU counts.

A running shoe buyer pulls up the style-level report for next season's cushioned trainer line. Every style is green. Sell-through is healthy, margins hold, nothing screams "cut me." And yet a competitor just took share in exactly this category with a shoe the buyer's line has no answer for. The style report didn't miss the trend. It couldn't see it, because the trend didn't live at the style level. It lived one layer down, in an attribute value nobody's line offered.
This is the blind spot in a lot of sporting goods assortment work. Style and SKU rollups tell you what sold. They don't tell you what shape of demand exists in the market and where your line has holes, redundancy, or a fence in the wrong place. To see that, you have to plan on the attributes underneath the style, not the style itself.
Why style-level reporting can't see the gap
A style-level report answers "how did this product do." An assortment decision needs to answer a different question: "given how demand is distributed across stack height, drop, price, capacity, whatever the category's real decision variables are, where is our line thin, thick, or misaligned with a break point customers actually feel?"
Those aren't the same question, and rolling up sales by style number erases the second one. A brand can have twelve running shoe styles that each look fine individually while the line has zero SKUs in a stack-height and price combination where a rival is winning, and forty combined units of overlap in a combination nobody needed three versions of. Style-level analysis will never surface either fact, because it never breaks the line into the attribute space that actually drives switching behavior.
Attribute-based planning has moved well beyond apparel for exactly this reason. Retailers now cull through several seasons of history to identify which attributes actually explain sell-through variation, then structure the buy around those attributes rather than the marketing-tier names printed on hangtags, per Impact Analytics' guide to assortment planning. Width, length, and depth of a range are still the vocabulary retail planning teams use, but that framing only works if depth is measured in real attribute values and not just SKU count, according to GAINSystems' overview of assortment planning.
Three failure modes hiding in the same style report
White space. Demand exists in a combination of attribute values, and the line offers nothing there. A hiking boot line might be strong at every price point in a mid-cut, moderate-support silhouette and have nothing in a low-cut, high-stability combination that trail runners keep asking about in reviews. The gap won't show up as a missing style. It shows up as a missing cell in an attribute grid nobody built.
Over-assortment. The mirror image. A segment gets more SKUs than the demand curve supports, usually because it's easy to line-extend a working silhouette by color or minor cosmetic change rather than by a real attribute shift. Fourteen versions of the same stack height and price band cannibalize each other's sell-through and clutter the floor plan or the PDP grid, while the extra SKUs add carrying cost and forecast noise without adding demand coverage.
Break points. The line's price or spec tiers land in the wrong place relative to where customers actually switch preference. If most buyers in a category flip from entry to premium somewhere around a specific stack-height or price threshold, and the brand's tier boundary sits five dollars or two millimeters off that point, every SKU near the boundary underperforms for a structural reason that a style report will misread as a product problem.
A worked example: cushioned trainers by stack height and price
Take a mid-size running shoe line. Assign every style two attributes on top of price: heel stack height in millimeters and heel-to-toe drop in millimeters, both pulled from spec sheets rather than marketing names like "Max Cushion" or "Balanced Ride," which vary meaning from season to season and tell a planning system nothing consistent.
Plot styles on a grid of price band against stack-height band, with dot size showing SKU count offered and color showing sell-through rate.
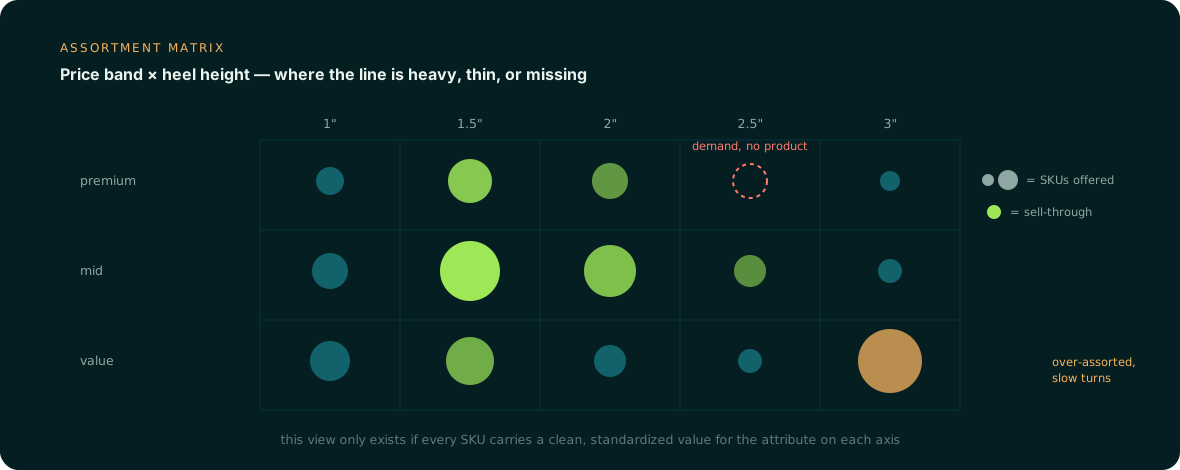
In this kind of view, two cells usually jump out. One cell, mid-stack height at a mid price band, is crowded: a dozen-plus SKUs, decent but unremarkable sell-through per SKU, because the brand kept extending a working style instead of moving into new attribute territory. Another cell, max-stack height at a slightly higher price band, is empty, but the review text and search data for that combination is strong, and a competitor's equivalent combination is selling well. That's a line decision waiting to happen: cut two or three of the redundant mid-stack SKUs and fund one or two new max-stack styles at the next price band up.
None of that decision is visible from a style-level sell-through table. It only becomes visible once stack height, drop, and price are structured, filled, and consistent across every style in the line, including the ones that launched three seasons ago and never got a spec-sheet attribute pass.
What the data has to look like before this works
The matrix above only tells the truth if three things are true of the underlying attribute data.
| Requirement | What breaks without it |
|---|---|
| Fill | Attributes missing on older or lower-volume styles create blank cells that look like white space but are really just missing data |
| Standardization | "High stack" on one style and "32mm" on another can't be plotted on the same axis, so the grid silently drops or misbins products |
| Correctness | An attribute pulled from marketing copy instead of the spec sheet or tech pack can misplace a style in the wrong cell entirely |
Getting there is a data operations problem, not a planning-software problem. It means extracting stack height, drop, capacity, or flex rating directly from tech packs, spec sheets, and lab test documents, not from product titles. It means normalizing units and bucket definitions across every brand and season so a 2023 style and a 2026 style land on the same axis. And it means flagging conflicts, a spec sheet says 30 millimeters and a marketing deck says "high stack," rather than picking one silently and moving on.
This is true well beyond running shoes. Hiking packs segment by liter capacity and frame type, bikes by frame size and groupset tier, golf shafts by flex rating, team equipment by weight class. In every case, the assortment decision that matters is one level below the style number, and it only becomes visible when the attribute data underneath is complete, consistent, and verified.
That's the layer Anglera works on. Your PIM or planning system stores the style and the sales history; Anglera extracts and validates the attribute columns, stack height, drop, capacity, fill weight, from the source documents and imagery that already exist, so the assortment grid a planner builds is showing real structure instead of gaps created by missing or inconsistent data.