
More of what's selling, less of what's not — at the attribute level
Style-color sell-through is noisy. Roll up the same sales history by attribute value and the winners, losers, and white space stop hiding.

Strip away the dashboards and the buy meeting comes down to one sentence: buy more of what sells, less of what does not. Every planning tool, every forecasting model, every OTB exercise is a more sophisticated way of answering that question. The problem is where most teams answer it — at style-color, the level the PIM and the POS system agree on — because that is exactly the level where the signal is thinnest and the noise is loudest.
Why style-color is the wrong resolution
A style-color sells 340 units over a season. Is that good? It depends on things the style-color number does not tell you: was it a mid-weight fabric in a heavyweight season, a wide-fit shoe in a narrow-fit region, a matte finish competing against a glossy trend. Style-color performance is an aggregate of every attribute that shaped the customer's decision, collapsed into a single SKU-family total. You can rank 200 style-colors by sell-through and get a list. You cannot get a reason.
Attributes are the dimensions a forecast actually aggregates along. Fabric weight, fit, finish, closure type, sole material, pack size, whatever matters in your category. When those dimensions are populated consistently, you can ask a much sharper question than "which style sold": you can ask which fabric weight sold, which fit sold, which finish sold, across every style that carried it. That question has enough sample size to be a signal instead of a coincidence.
This is not a new idea inside planning software. Assortment tools already let planners build attribute rollups — grouping the catalog by brand, color, fabric, or similar dimensions instead of by item — specifically because attribute-level views surface patterns single-item hindsight reports miss. The mechanism works. It just needs attributes worth aggregating on.
The mechanics: attach, roll up, rank
The exercise itself is simple and most planning teams already have the tools to run it once the inputs are clean:
- Attach a validated attribute set to every SKU in the sales history — not just the attributes marketing cares about for search, but the ones that actually drive purchase intent in your category.
- Join attributes to sell-through, sell-through rate, GMROI, and markdown depth by SKU and location.
- Roll up each metric by attribute value instead of by item: every "wide fit" SKU together, every "12oz fabric" SKU together, every "quick-release buckle" SKU together.
- Rank the values. Not the items — the values.
What falls out is a demand curve with a real break point: a cluster of attribute values that consistently outsell the assortment average, a cluster that consistently drags it down, and — the part planners chase hardest — combinations of attribute values nobody has actually carried yet. That gap is buy-side white space: a fit and fabric and finish combination the sell-through curve says should work, sitting unbought because no single SKU embodied it long enough to prove it in isolation.
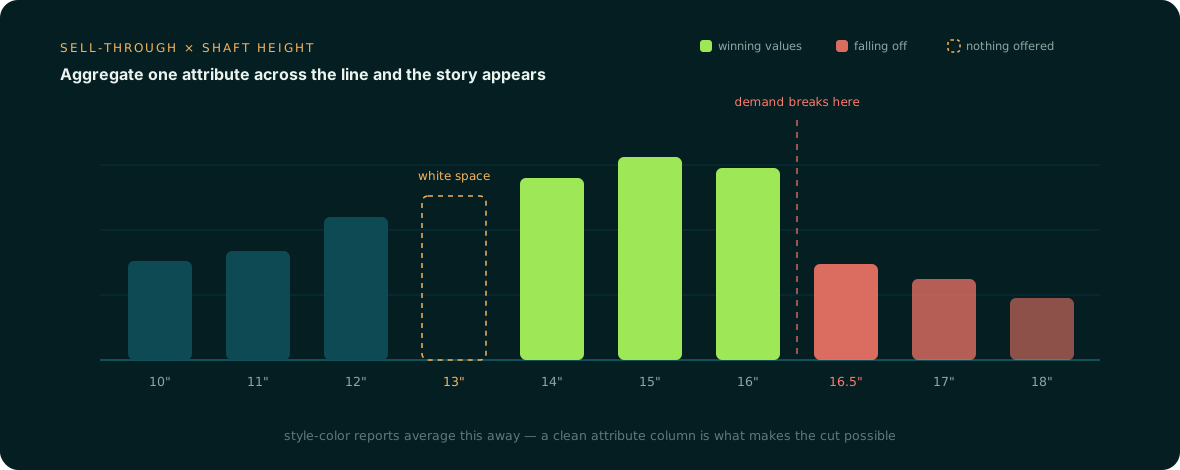
This is the same logic underneath new-item forecasting for products with no sales history of their own. When a style has never been sold before, planning teams borrow demand from analogs — items that share enough attributes to stand in as a proxy — because attribute similarity, not item identity, is what most new-product forecasts actually run on. If that logic is sound for new items, it is sound for the entire back book too. You do not need a new style to test a hypothesis about fit or fabric — you need clean rollups of the SKUs you already carry.
The trap: attributes that exist but lie
Most retailers already have an attribute called "fit" or "material" in the PIM. The trap is trusting it. Attribute fields populated by hand across seasons, vendors, and category managers drift: "wide" in one vendor's feed, "W" in another's, "extra room" in the free-text description of a third. A rollup built on that field is not measuring fit — it is measuring which vendor filled out the form most consistently.
| Signal | Looks reliable | Actually is |
|---|---|---|
| Attribute is populated on 95% of SKUs | Yes | Only if values are consistent across vendors and seasons |
| Attribute matches spec sheet or tech pack | Sometimes | Free-text fields drift from source docs over time |
| Attribute was validated against imagery or reviews | Rarely done | The strongest signal, and the one most catalogs skip |
| Attribute conflicts flagged when sources disagree | Almost never | Silent overwrites are the default, and they poison rollups quietly |
This is the failure mode that makes attribute-level analysis harder to trust than style-color analysis, even though it is more useful in principle. A noisy but honest style-color total is at least honest about being an aggregate. A confidently labeled attribute field that is 15% wrong will produce a rollup that looks precise and is not, and a planner will make a real buy decision off it. Data quality problems in forecasting are rarely new; teams generally already knew about the gaps in their attribute foundation before a forecasting initiative forced the issue.
What changes in the buy meeting
When attributes are extracted from the same underlying source documents every time, and every mismatch between sources gets flagged instead of silently resolved, the rollup earns the right to be trusted. The buy meeting stops being "did style 4471 sell" and starts being "wide-fit sold 22% ahead of narrow-fit in this category this season, and we are under-bought on wide-fit heading into next season." That is a decision a merchant can defend to a CFO. A style-color anecdote is not.
None of this requires new software layered on top of the planning stack. It requires the attribute data feeding that stack to be complete, consistently defined, and validated against its source — imagery, tech packs, spec sheets, reviews — the same way every time. Anglera does that extraction and validation work against whatever PIM, MDM, or flat file already holds the catalog, flags conflicting values instead of guessing, and backfills a new attribute across the full assortment fast enough to make it usable in the next buy cycle, not the one after.