
The planner's ROI case for product data: find the money
A planning leader's CFO-ready case for product data: where the markdown, dead-stock, and returns money actually hides, and how to size it.

Every planning team has a line item called the markdown budget, and every planning team treats it like weather. It isn't. Markdowns are downstream of buys, buys are downstream of forecasts, and forecasts are downstream of the attributes a system used to group items that behave alike. When those attributes are thin, wrong, or free-text, the forecast is guessing with better formatting. The ROI case for fixing product data has mostly been told as an e-commerce story: cleaner filters, better search, a few points of conversion. That case is real but small. The planning case is bigger, and it's the one a CFO will actually fund.
The four places the money hides
Retailers already track most of these losses. They just attribute them to demand volatility instead of to the data quality problem sitting underneath the demand model.
Buy quality. A forecast that treats "navy," "Navy Blue," and "NVY" as three different items, or that has no field at all for closure type, sole material, or pattern, can't tell you which navy actually sold. It averages across a group that was never really one group. The buy gets built on a blended signal, so the org over-orders the losers and under-orders the winners.
Dead inventory and markdowns. Carrying cost on unsold inventory typically runs 20% to 30% of inventory value annually once you count storage, insurance, capital cost, and obsolescence, and some retailers see it higher. Markdowns are the release valve for that pressure, and by at least one NRF-sourced estimate, more than 30% of retail inventory gets marked down in a given year. Both numbers are driven by the same root cause: the buy didn't match true demand at the attribute level, so excess sits in the wrong sizes, colors, or configurations.
New-product forecast misses. New items have no sales history, so the model has to borrow from analogs, items that share enough attributes to behave similarly. If the attribute set is sparse, the analog match is bad and the launch forecast is a coin flip. Where retailers have invested in attribute-based forecasting for new introductions, the results are notable: one published case involving a company launching roughly 2,000 new styles a year cut new-launch forecast error (WMAPE) by 10%, with launch-specific accuracy improving around 30% after moving from a flat, historyless approach to one grouped by tested attributes. The lever wasn't a smarter algorithm. It was better inputs to an algorithm that already existed.
Returns avoided via fit signal. This one gets filed under customer experience, but it's an inventory problem too: a returned item comes back as damaged, off-season, or unsellable at full price. In apparel and footwear, fit and sizing account for as much as 70% of returns, and shoppers increasingly practice "bracketing," ordering multiple sizes and returning what doesn't fit, which inflates both return volume and the phantom demand a forecast thinks it saw. Clean, consistent fit attributes (true-to-size flags, width, fit-model notes pulled from tech packs and reviews) don't eliminate this behavior, but they narrow the gap between what a shopper thinks they're ordering and what actually shows up.
Reading the demand curve, not just the sales report
Most planning teams look at sell-through by SKU or by category. Few look at sell-through by attribute value, which is where the buy signal actually lives. Plot sell-through against attribute values within a category and you typically see a small cluster of values that dramatically outperform, a sharp break point where performance falls off, and a stretch of attribute combinations the catalog never carried at all, meaning nobody knows if that white space would have sold.
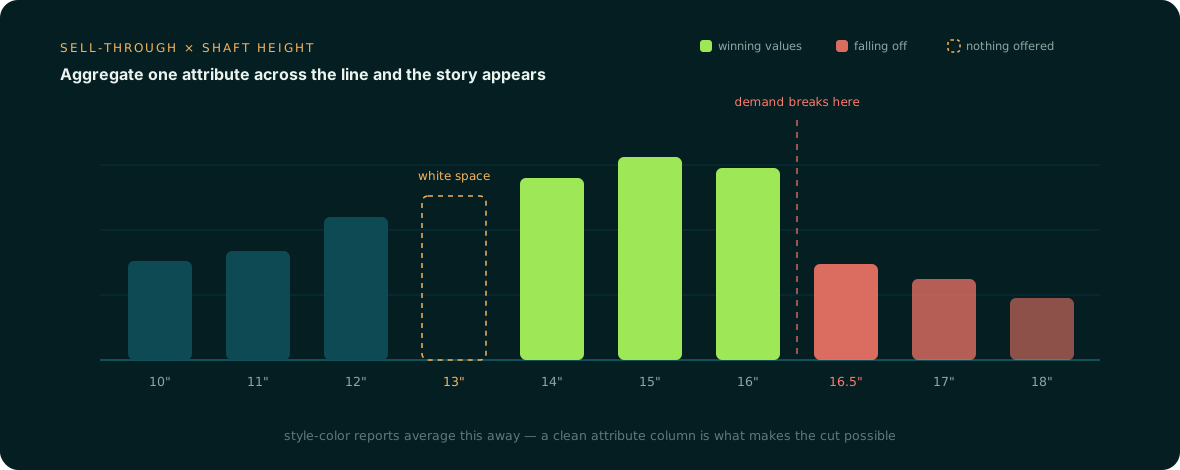
That white space is where next season's buy either gets smarter or repeats last season's mistake. You can't see it if "material" is a free-text field with forty spellings of the same three fabrics.
Sizing the case for a CFO
Here's a rough way to frame the math, using ranges grounded in the sources above rather than invented precision.
| Lever | Where it shows up | Typical driver | Rough sizing approach |
|---|---|---|---|
| Buy accuracy | Open-to-buy, initial allocation | Attribute-level demand blended into noisy averages | Estimate value of shifting 5-10% of unit buy from underperforming to top-decile attribute values |
| Dead stock and markdowns | End-of-season clearance, aged inventory | Excess in wrong attribute combinations | Apply 20-30% carrying cost and 30%+ markdown-exposure rate to current excess inventory value |
| New-product misses | Launch-period stockouts and overstock | Weak or missing attributes for analog matching | Compare launch forecast error before/after attribute enrichment on a pilot category |
| Fit-driven returns | Return processing, unsellable returns | Missing or inconsistent size/fit attributes | Multiply return volume by share attributable to fit, then by unsellable-on-return rate |
None of these levers needs a new forecasting engine to pay off. They need the attribute layer the existing engine already depends on to actually be trustworthy.
Why the spend is small against any of this
The natural objection is that fixing product data at scale sounds like a multi-quarter IT project. It doesn't have to be. Anglera plugs into whatever PIM, MDM, ERP, or flat file a retailer already runs, extracting and normalizing attributes from the source documents that already exist (tech packs, spec sheets, imagery, reviews) rather than asking anyone to re-platform. A style-number-and-SKU export is enough to start, most catalogs are live in 30 days or less, and a new attribute (say, a consistent fit-type field pulled from spec sheets) can be backfilled across thousands of SKUs in about a day, instead of the 30-45 minutes per SKU manual enrichment typically takes. Against a markdown budget that's touching a third of inventory or a returns line that's eating margin on fit alone, that's not a big ask.
Product data enrichment doesn't replace the forecasting model, the buy meeting, or the planner's judgment. It fixes the dimensions those decisions get aggregated along, so the same models and the same people finally have inputs worth trusting.