
How to measure product data accuracy (and audit outsourced data entry)
Measure product data accuracy by checking a random sample of attribute values against a source of truth, then report the error rate with a confidence interval.

You measure product data accuracy by checking a random sample of attribute values against a defined source of truth for each attribute, then dividing correct values by values checked. Report it as a field-level error rate with a confidence interval, broken out by supplier, vendor, and category, because one catalog-wide percentage hides where the wrong values live.
Accuracy is not completeness
IBM defines accuracy as how well data represents real-world entities and whether it can be validated against trusted sources, and completeness as whether all required values are present (IBM). The two move independently. Fill rate is cheap to measure: count the non-empty cells. Accuracy needs what Apollon calls an external truth, a reference the value can be checked against.
That gap is where catalogs get hurt. A voltage column that is 95% filled looks finished on a dashboard. If a chunk of those values were copied from a sibling SKU's spec sheet, the dashboard cannot tell you, and the buyer finds out at install.
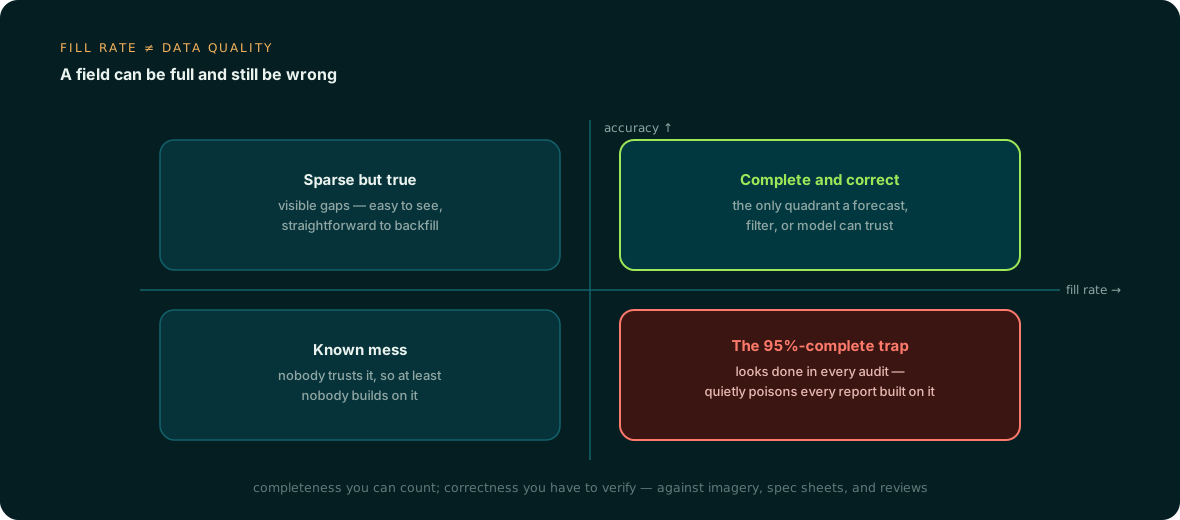
We go deeper on that split in fill rate vs accuracy.
Data quality dimensions, and where accuracy sits among them
IBM lists six dimensions: accuracy, completeness, consistency, timeliness, validity, and uniqueness (IBM). ISO 8000-8 frames it differently, as syntactic quality (data conforms to its specified syntax), semantic quality (data corresponds to what it represents), and pragmatic quality (data is suitable for a particular purpose). The standard says syntactic and semantic quality are measured through verification and pragmatic quality through validation (ISO 8000-8 preview; summary at arc42).
The practical translation for a product catalog:
- Validity, or syntactic checks, run on 100% of records automatically: GTIN check-digit logic, value ranges, unit plausibility (Apollon). A
gtinwith a bad check digit or aweightof0fails without anyone opening a PDF. - Accuracy, or semantic checks, ask whether
max_operating_pressure: 150 psiis actually true of that valve. A rule cannot answer that. ISO 8000-8 notes that a complete check of correspondence is in many cases close to impossible, and that sampling and statistical methods can give a probabilistic view instead (ISO 8000-8 preview).
That note is the case for a sampling audit. Valid is not the same as true: 24 VDC passes every format rule on a 120 VAC contactor.
How to measure product data accuracy in five steps
1. Define the truth source for each attribute
Decide what "correct" means before anyone scores, including the match rule. Ruling on "close enough" after the fact is how audits drift.
| Attribute | Truth source | Match rule |
|---|---|---|
gtin, mpn | Brand owner's record or the package | Exact |
height, width, depth, gross_weight | Manufacturer spec sheet or physical measurement | Within tolerance |
voltage, amperage | Spec sheet or nameplate | Exact after unit normalization |
material, finish | Spec sheet | Match to your controlled vocabulary |
cost | Current supplier price list | Exact |
For package dimensions, GS1 Canada flags discrepancies against a global standard tolerance of plus or minus 4% (GS1 Canada). For prices, stock, and identifiers, Inventory Source recommends checking against the latest supplier price list, inventory system, and source records.
2. Draw a random, stratified sample
Pull the sample at random from what was delivered, not the first 100 rows of the file. Stratify by supplier and category so each slice you plan to report on gets enough checks. Inventory Source suggests mixing categories, high-value items, and frequently updated SKUs into a controlled sample before approving a full feed.
Include blanks. If you only sample filled fields, you never catch a value that exists on the spec sheet but was left empty.
3. Score each field, then roll up
Mark every checked value as correct, wrong, wrongly blank, or wrongly filled (a value where the attribute does not apply). Keep wrong and missing as separate counts so accuracy and completeness stay separate numbers.
Then report two rates. ARDEM's SLA framing is useful here: field-level accuracy as the share of fields captured correctly, by criticality, and record-level accuracy as the share of records with zero critical-field errors (ARDEM). Apollon also advises stating which share was checked automatically and which by manual sampling.
4. Compute the error rate with a confidence interval
A point estimate from a small sample is a guess. For a proportion, NIST's handbook gives the Wilson interval and notes that Agresti and Coull recommended it for virtually all combinations of sample size and proportion (NIST).
For illustration: you sample 150 SKUs from a vendor batch and check 8 critical attributes each, which is 1,200 field checks. You find 36 wrong values, a 3.0% error rate. The 95% Wilson interval is roughly 2.2% to 4.1%. Now run the same 3% on only 100 checks (3 errors): the interval widens to roughly 1.0% to 8.5%. That sample cannot tell a good vendor from a poor one.
One caveat. Errors inside a single SKU are correlated (same keyer, same spec sheet), so a field-level interval is somewhat optimistic. Report the SKU-level rate next to it.
5. Track by supplier, vendor, and category over time
Report the rate per source, not just per catalog. Tag each error with a cause, because each one points to a different fix:
- Transcription:
3/4 inkeyed as3/8 in. - Unit: millimetres stored in an inches field.
- Wrong source: a value taken from a sibling SKU or the wrong revision of the sheet.
- Stale: the manufacturer revised the spec and nobody re-checked.
- Unsupported: no source document backs the value at all.
How to check the quality of outsourced product data entry
Treat each delivered batch as a lot you accept or reject. You draw the sample, not the vendor. An independent reviewer checks it against the same source document the keyer used, which means the vendor has to record the source for every value. If nobody can say which page of which PDF a value came from, you can audit the format but not the truth.
ExtendedDesk recommends splitting the work so one person enters and another validates, and logging errors by category to find training or form-design problems (ExtendedDesk). Both fit inside the audit above. Our comparison of outsourced data entry covers the wider trade-offs.
How to write accuracy into an outsourcing SLA
A clause that says "99% accurate" with no method attached is hard to enforce. Spell out:
- Definition. Field-level accuracy by criticality tier, plus record-level accuracy on critical fields.
- Truth sources and match rules, as an appendix (the table from step 1).
- Sampling. Who draws it (you), sample size per batch and per stratum, and a logged random seed.
- Acceptance rule. Judge the batch on the upper bound of the 95% interval, not the point estimate, so a lucky small sample cannot pass a bad batch.
- Rework. A failed batch is corrected and re-sampled at the vendor's cost.
- Traceability. ARDEM lists user-level change logs, reviewer identity, reason codes for overrides, and before/after correction logs.
On targets, ARDEM publishes directional ranges of 99.2% to 99.8% for structured forms and 97.0% to 99.2% for multi-source packets. Attribute work from spec sheets and catalogs usually resembles the second. Set your number from a baseline audit of your own data, not a vendor brochure.
What goes wrong in accuracy audits
- Circular checks. The reviewer compares the value to the same spreadsheet the keyer produced instead of the source document.
- One audit, then never again. Spec sheets get revised, so last year's correct value can be wrong today.
- One number for the whole catalog. A 2% average can hide a single supplier at 12%.
- No cause codes. You know the rate but not whether to retrain, fix a form, or replace a source.
For a scorecard that combines accuracy with the other dimensions, see how to measure product data quality and our post on scoring product data quality.
Who does the work, and how that changes the audit
The audit is only as cheap as the provenance behind each value. This is where Anglera fits: your PIM stores the data, and Anglera does the work of extracting attribute values from spec sheets, catalogs, and manufacturer sites, quality-scoring them, and flagging conflicts for review instead of inventing a value. It works alongside your PIM, ERP, or a flat CSV export, and typical implementation is about 30 days.
When each value carries a pointer to its source document, the sampling audit above becomes closer to a lookup than an investigation. Whether the work is done in-house, by a BPO, or by Anglera, ask for the same thing: a random sample, a named truth source, and an error rate with its interval.
Hero photograph by EqualStock on Unsplash