
How much does product data enrichment cost per SKU?
Self-serve AI tools publish $0.30 to $0.75 per SKU; technical B2B items run several dollars each once review and upkeep count. Pricing models and the math.

Published self-serve AI enrichment tools charge roughly $0.30 to $0.75 per product, while service providers quote indicative bands from about £0.30 per SKU for simple retail lines up to £12 per SKU for technical industrial lines. The real per-SKU cost is the number of attributes you need filled, multiplied by how hard each value is to find and verify, plus a separate yearly cost to keep those values current.
That second sentence is the one buyers skip. A sticker price per product tells you what the tool charges for one run. It does not tell you what a finished, trusted record costs, or what it costs to keep it trusted next year.
How much product data enrichment costs per SKU, by pricing model
Five pricing models show up in quotes. Each one hides a different part of the bill.
| Model | Published example | What the unit leaves out |
|---|---|---|
| Per SKU (self-serve AI) | FacetFlux lists $0.30–$0.60 per product for enrichment; Describely lists $0.75 per product | Human review of low-confidence values; re-runs |
| Per step or credit | Dyver prices an Enrichment Token at $0.04, with full enrichment from raw supplier data at 16 tokens, or $0.64 | Total is hard to forecast until you know which steps each SKU needs |
| Bundled PIM credits | Plytix includes 500 AI credits per month on every plan | Overage pricing, and whether the output is sourced or generated |
| Service bands (per SKU) | £0.30–£1.50 simple retail, £1.50–£4.00 mid-complexity distributor, £4.00–£12.00 technical industrial (40 to 80 attributes) | Usually scoped to a backlog, so upkeep is quoted separately |
| Hourly BPO or in-house FTE | BLS puts median pay for general office clerks at $21.64 an hour in May 2025 | Rework, QA, and the time spent hunting for the source document |
Sources for the table: FacetFlux pricing, Describely pricing, Dyver's itemized pricing, Plytix pricing, Start With Data's cost bands, and the BLS occupational outlook for general office clerks. Vendor prices change; confirm against the current page before you budget.
Notice the spread. The self-serve tools cluster under a dollar because they are pricing a run of a model. The service bands climb past £10 because they are pricing a verified technical record, where someone has to open a cut sheet and read the Voltage Rating off a table.
The five variables that move per-SKU cost
Attribute depth. A title, description, and five bullets is one job. Forty category-specific attributes on a Ball Valve (Body Material, End Connection, Pressure Rating, Port Size, Temperature Range, certifications) is a different job. Per-SKU quotes that do not name the attribute list are not comparable.
Source availability. If the manufacturer publishes a clean spec sheet, extraction is fast. If the only source is a scanned PDF catalog, or nothing beyond an ERP short description like VLV BALL 1/2 NPT SS, effort per value multiplies. Hootcore makes the same point: the spread comes from what you send in, not how many products you send (Hootcore).
Category complexity. Apparel attributes are mostly visible in the image. Electrical, fluid power, and MRO attributes live in tables and footnotes, and units have to be normalized (1/2 in, 0.5", and 12.7 mm are one value).
Accuracy bar. Marketing copy tolerates paraphrase. A Max Operating Pressure that drives a buyer's spec decision does not. The higher the bar, the larger the share of values that need a human check, and on technical catalogs that review time can outweigh the tool bill.
Ongoing maintenance. Suppliers revise specs, discontinue parts, and add SKUs. Every one of those events reopens records you already paid to enrich.
Worked example: a 20,000-SKU distributor catalog
For illustration only, assume a 20,000-SKU industrial catalog with 15 attributes in scope per category, and that a trained person needs about 2 minutes per value when the source document is at hand.
In-house or hourly. 15 values at 2 minutes is 30 minutes per SKU, so 10,000 hours for the catalog. At the BLS clerk median of $21.64 an hour, that is $216,400 in wages alone, or about $10.82 per SKU before benefits, management, and QA. Converted roughly to dollars, that falls within the technical industrial band above, which is a useful sanity check, though that band assumes far more attributes per SKU.
Self-serve AI plus review. At $0.30 to $0.75 per product, the tool bill is $6,000 to $15,000. Now assume 30% of SKUs come back with values a buyer cannot trust without checking, and each check takes 10 minutes. That is 6,000 SKUs, 1,000 hours, and $21,640 in review labor. Total: $27,640 to $36,640, or roughly $1.38 to $1.83 per SKU. The review assumption moves this number more than the tool price does, so test it on a real sample before you plug it in.
Service provider. On the quoted bands, a technical industrial line at £4 to £12 per SKU is £80,000 to £240,000 for the backlog. Ask what is included after the backlog is done.
Hootcore's own illustration shows the same pattern: a 50,000-SKU catalog at a $0.75 list rate blends to $1.03 per record on the first pass, with the gap coming from the 10% of records that arrive with almost no data (Hootcore).
One-time cost vs the cost of keeping data current
Most quotes price the backlog. The catalog does not stay finished.
Continue the illustration: if 2,000 existing SKUs get a supplier revision each year and 3,000 new SKUs arrive, that is 5,000 records to touch. In-house at 30 minutes each, that is 2,500 hours, about $54,100 a year, or roughly a quarter of the original backlog cost every year. If no one owns that work, the records quietly drift out of date, which is the cost covered in what product data decay actually costs.
So budget two numbers: a one-time backfill cost per SKU, and an annual maintenance cost per SKU under management. A vendor who only quotes the first is quoting a project.
Enrichment API and PIM AI attribute pricing: what the unit buys
When a PIM or API sells "AI credits," ask three questions.
- What does one credit produce? A description, a single attribute value, or a whole record. Dyver, for example, prices attribute extraction and categorization at 8 tokens, or $0.32, separately from image work (Dyver).
- Where does the value come from? A value read from the manufacturer's spec sheet and linked back to it is auditable. A value a language model inferred from the title is a guess with good grammar.
- What happens to conflicts? If the ERP says
304 SSand the spec sheet says316 SS, does the tool pick one silently or flag it?
Credit pricing is cheap per unit and fine for copy. For technical attributes, the cost that matters is the cost per value you can stand behind.
Who does the work, and what that does to the per-SKU number
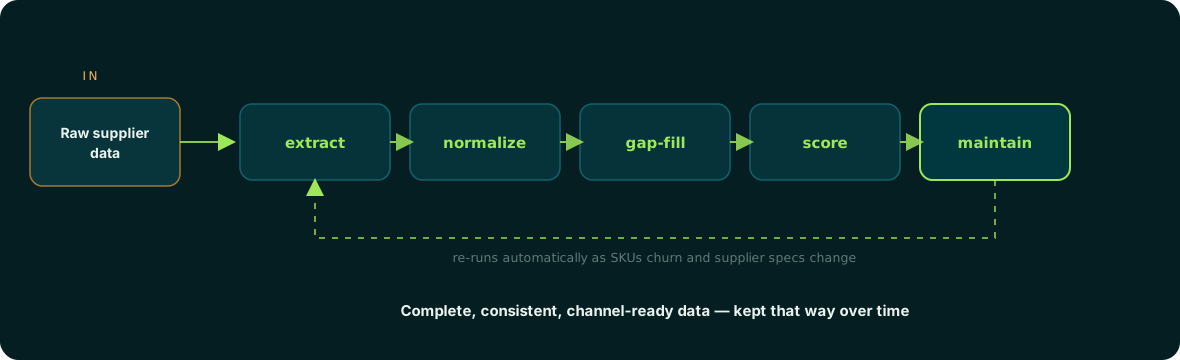
The per-SKU figure depends less on the software than on who reads the source documents, resolves conflicts, and re-runs the work when suppliers change things. Your PIM stores the data. Anglera does the work: it extracts attribute values from spec sheets, catalogs, imagery, and manufacturer sites, normalizes them, quality-scores each one, and flags conflicts for review instead of inventing values. It works alongside whatever PIM, ERP, or syndication platform you run, or from a flat CSV export, and a typical implementation takes 30 days or less. Because it runs as a maintained practice rather than a one-off project, new attributes can be backfilled across the catalog and updates flow through without reopening a statement of work. The mechanics are on how Anglera works.
If you are weighing staff, offshore teams, and software against each other, the build vs buy guide for product data enrichment walks the trade-offs, and the comparison of product data enrichment platforms lays out the vendor options. For catalogs where most SKUs sell rarely, the economics of long-tail SKUs shows why per-SKU cost needs to be weighed against per-SKU revenue.
How to get a per-SKU number you can trust
Pull 100 to 200 SKUs across your hardest and easiest categories. Write down the exact attribute list per category and your accuracy bar. Give the same sample to every vendor and score the output against the source documents yourself. Then ask each one for two prices: backfill per SKU, and maintenance per SKU per year.
That sample will tell you more than any published rate card. A per-SKU price only means something once you know which values come back sourced, which get flagged, and who keeps them current. That last part is the work Anglera is built to carry, next to the systems you already have.
Hero photograph by Harshit Suryawanshi on Unsplash