
How to prioritize which SKUs to enrich first
Prioritize SKUs to enrich by value times gap: score revenue, search demand, margin, returns and channel blockers, then multiply by how much data is missing.
Prioritize SKUs to enrich by multiplying what a SKU is worth to fix by how much of it is broken: score each SKU family on revenue or velocity, search demand (including zero-result queries), margin, return rate, and channel requirements it currently fails, then multiply that value score by its data gap, the share of category-required attributes that are empty or wrong. Work the list from the highest product down, which usually puts under-described long-tail families and channel-blocked SKUs ahead of your best sellers, because best sellers tend to be the SKUs that are already complete.
Why top-sellers-first is the wrong default
The common advice is to start with revenue. Atropim's guide suggests the top 20% of products by revenue plus anything flagged for poor search or high returns, and Gigacommerce's playbook starts with the 50 to 100 hero SKUs that drive most revenue. For a distributor carrying 80,000 SKUs from 400 manufacturers, it misfires in two ways.
First, the best sellers are rarely where the gaps are. A top-selling nitrile glove has been touched by merchandising, sales reps, and the manufacturer's own content team for years. Its thickness_mil, size, and powder_free fields are probably filled. Enriching it further moves little.
Second, revenue measures demand you already capture, not demand you lose. A buyer searching 316 stainless hose clamp 1-3/4 in who gets nothing back never shows up in a sales report. The long-tail SKU families that would have answered that search are invisible to a revenue-sorted list precisely because nobody can find them. We cover the economics in more depth in long-tail SKU economics.
So revenue is one input, not the sort key.
The six inputs to an SKU enrichment prioritization score
Score at the SKU family or category level (all 1,200 hose clamps together), not SKU by SKU. Attributes are defined per category, and fixes land per category, so that is the unit of work. Rate each input 0 to 3.
Revenue or velocity. Trailing 12-month revenue or order lines. Use order lines for distributors where a few large accounts distort revenue.
Search demand. Site search terms that hit the family, plus zero-result and low-click queries that should have. If you run GA4 and your results URL carries a query parameter such as q or search, enhanced measurement logs a view_search_results event with a search_term parameter, so you can pull search terms without new tagging. Separating the zero-result ones takes your site search tool's own report or an extra results-count parameter. Map each failed term to the attribute value it names (316, 1-3/4 in, 14 in shaft). A cluster of failed searches naming one attribute is the strongest single signal you have.
Margin. Specialty and long-tail parts can carry better margin than commodity best sellers. Where yours do, recovering their demand pays more per order.
Return rate. Read the return reasons. "Wrong size" and "not compatible" are data problems. "Damaged in transit" is not, so do not score it.
Channel blockers. Fields a channel requires or penalizes when missing. Google states that products with missing or incorrect GTINs may have limited visibility, and it lists color, size, gender, and age_group as required for apparel in several countries, including the US. Requirements change, so confirm against each channel's current spec before scoring.
Data gap. The share of category-required attributes that are empty, unparsed, or failing validation. This is the multiplier, not one more additive term.
The formula, and why the gap multiplies
Use a weighted value score, then multiply:
value = 2 x revenue + 2 x search + margin + returns + 2 x channel (maximum 24)
priority = value x gap (gap as a fraction from 0 to 1)
The multiplication is the point. A family worth 20 that is already 95% complete scores 1. A family worth 12 that is 60% empty scores 7.2. Additive scoring would rank those the other way and send your team to polish what is already done.
One caution on the gap number: completeness is a floor, not a verdict. As Nexodo points out, a record can look nearly complete and still lack the one compatibility value that decides the purchase. Weight the gap toward the attributes buyers filter and compare on, not a raw count of filled fields.
A worked tiering table
For illustration, here is a hypothetical industrial distributor scoring six families. The scores are assumptions to show the arithmetic, not benchmarks.
| SKU family | Rev | Search | Margin | Returns | Channel | Value | Gap | Priority | Tier |
|---|---|---|---|---|---|---|---|---|---|
| Safety work boots | 2 | 2 | 2 | 3 | 3 | 19 | 0.45 | 8.6 | 1 |
| Stainless hose clamps | 1 | 3 | 3 | 1 | 1 | 14 | 0.60 | 8.4 | 1 |
| Threaded pipe fittings | 2 | 1 | 2 | 2 | 1 | 12 | 0.50 | 6.0 | 2 |
| Electrical connectors | 2 | 2 | 2 | 3 | 0 | 13 | 0.35 | 4.6 | 2 |
| Nitrile gloves (top sellers) | 3 | 3 | 1 | 0 | 0 | 13 | 0.10 | 1.3 | 3 |
| Discontinued legacy SKUs | 0 | 0 | 1 | 0 | 0 | 1 | 0.80 | 0.8 | 3 |
Tier 1 is 7 or more, Tier 2 is 4 up to 7, Tier 3 is below 4.
Read it from the bottom. The gloves are the biggest revenue line and land in Tier 3, because there is little left to fix. The legacy SKUs are mostly empty and also land in Tier 3, because nobody is looking for them. The boots win on channel blockers and returns: missing size and gender can keep them out of Google's apparel listings, and "wrong fit" drives returns. The hose clamps win almost entirely on failed searches and margin, with weak revenue, which is exactly the family a top-sellers list would have parked for next year.
How search demand at the attribute level changes the order
Zero-result queries tell you which attribute values buyers want, which is more specific than which SKUs they want. Group failed and low-click terms by the attribute they name, then plot demand across values.
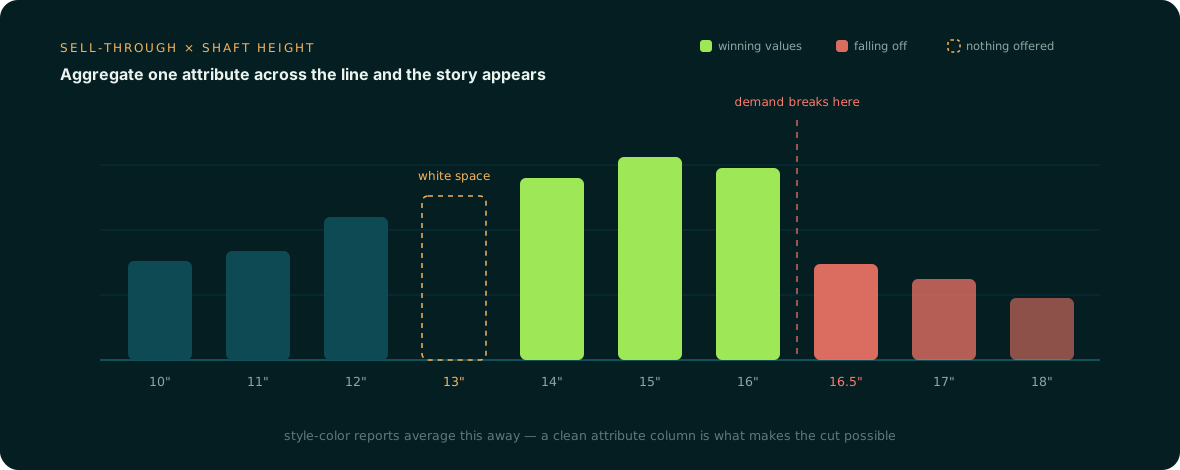
In the boot example, demand clusters at 14 to 16 inch shaft heights and falls off after 16.5. If shaft_height is empty on half the family, buyers filtering for 15 inches never see the boots you stock at that height. That is why the backlog should name attributes as well as families: "Tier 1: boots, shaft_height, size, gender" is a work order; "Tier 1: boots" is a wish. There is more on measuring this in what abandoned searches cost you.
Baymard's benchmark found that nearly 50% of sites fail to give users an effective way to recover from a search with no results. Better recovery UX helps, but if the matching product exists and its attributes are blank, the fix is the data.
What goes wrong when teams run this
Treating the gap as static. New SKUs arrive daily from supplier feeds with the same holes. Rescore monthly, or the Tier 1 list goes stale while you work it.
Filling gaps with guesses. A plausible but wrong thread_size is worse than a blank, because it now passes your completeness check and fails the buyer. Google says plainly, for GTINs, don't guess or make up a value. Apply the same rule to every spec field: each value should trace to a spec sheet, catalog page, or manufacturer site.
Ignoring confidence. Research on agentic enrichment, such as the TRACE paper, routes uncertain proposals to human review rather than writing them, and reports enrichment coverage weighted by impressions, not just attribute counts. Both habits belong in any prioritization program.
Who does the work once the list exists
The scoring can be done in a spreadsheet. The hard part is staffing the backlog, because Tier 1 alone can be tens of thousands of attribute values pulled from PDFs and manufacturer pages. For illustration, 3,000 SKUs needing 8 attributes each at 2 minutes per value is 800 hours of manual entry, and the list refreshes every month.
That is the work Anglera takes on. Your PIM stores the data; Anglera extracts values from the real source documents, scores them, flags conflicts for review, and writes back to whatever PIM, ERP, or flat file you run. See how it works, or the guide to enriching product data at scale for the operating model.
Deciding where to start this week
Pull 12 months of order lines, 90 days of site search terms, return reasons, and each channel's error report. Score your top 30 families on the six inputs, multiply by gap, and take the top five into Tier 1 with the specific attributes named.
If you want the backlog worked continuously rather than once, Anglera starts from a flat CSV or ERP export and typically goes live in 30 days or less, backfilling a new attribute across a family when your scoring says it matters. The ranking stays yours; the source-grounded filling is what we run.
Hero photograph by Bernd 📷 Dittrich on Unsplash