
How to read the 2026 PIM Magic Quadrant without buying the wrong PIM
What Gartner’s 2026 PIM Magic Quadrant weights, what each quadrant means for your catalog, and a 6-step process to turn the report into a shortlist.
An ecommerce director at a 15,000-SKU electrical distributor forwards the new Gartner report to her team with one line: "Shortlist the Leaders." It is the most natural reaction to a Magic Quadrant, and for a business her size it is usually the wrong one.
Gartner published its Magic Quadrant for Product Information Management Solutions on 12 October 2026, replacing the Market Guide it previously wrote for the category. Sixteen vendors, four quadrants. We keep the placements and our full read of the report on the 2026 PIM Magic Quadrant hub.
Here is the verdict up front. The MQ is a solid map of who builds credible PIM software and who will still be around in five years. It is not a ranking of fit, and it says nothing about the biggest cost in your project: the people who will fill the records once the software is live. Read it for the first job. Do the second one yourself.
What the two axes actually weight
Every dot on the chart is a weighted sum. The weights tell you what "up and to the right" means.
| Axis | Weighted high | Weighted medium | Not rated |
|---|---|---|---|
| Ability to Execute | Product or service; overall viability | Sales execution and pricing; market responsiveness; customer experience | Marketing execution; operations |
| Completeness of Vision | Offering (product) strategy; innovation | Market understanding; vertical or industry strategy; geographic strategy | Marketing strategy; sales strategy; business model |
Two things stand out for a buyer.
First, the vertical axis rewards breadth of product and staying power. A vendor can rise by covering more of the 17 features Gartner lists and by being financially solid. Neither tells you whether it fits a 40-category industrial catalog with 300 suppliers.
Second, industry strategy is only a medium weight. A vendor with deep distributor templates and one with none can land close together. If your catalog is specialized, the dot hides the thing you care about most.
Then there is the line that should get more attention than it does. Business model is not rated, because Gartner sees little difference between how PIM vendors operate. That is a fair call, and it is telling. Every vendor in the report sells the same kind of thing: software your team uses. Gartner’s own definition says a PIM enables an organization to centralize, enrich and validate product content. We unpack what that word choice means in the definition piece. The short version: the business model is identical because the work model is identical. The vendor ships the system, and your team does the filling.
What each quadrant means for you
Gartner’s quadrant descriptions are about vendors. Translate them into what they mean for your catalog.
Leaders (Akeneo, Inriver, Salesforce (Informatica), Stibo Systems, Syndigo). Mature, scalable, broad enterprise coverage. Gartner also notes Leaders may need extra configuration for specialized or local regulation and can be heavy for smaller organizations. If you run several business units across regions, start here. If you run one distribution business with a lean team, you may pay for breadth you never configure.
Challenger (Salsify). Strong, reliable execution, sometimes narrower. Salsify’s center of gravity is brands syndicating to retailers, and Gartner cautions that its footprint in complex B2B industrial manufacturing is limited. Right fit for a brand-to-retail motion; pressure-test it hard for a 60-attribute industrial category.
Visionaries (Bluestone PIM, Pimcore, Viamedici). Early on AI agents and modern architecture, less established execution. A good match if you have engineers who want a composable, API-first stack and can absorb some roadmap risk.
Niche Players (apollon, Base.com, Centric Software, Equadis, insightsoftware, Pimberly, Plytix). Focused on a segment, a region or the midmarket, and often cost-effective in that lane. "Niche" is a statement about scope, not quality. Gartner credits insightsoftware’s Agility PIM with extensive distributor and wholesaler experience and describes Pimberly as distributor-centric. For the director above, that may be the precise fit the Leaders box is not. Our distributor read of the report goes deeper.
Turn the report into a shortlist in six steps
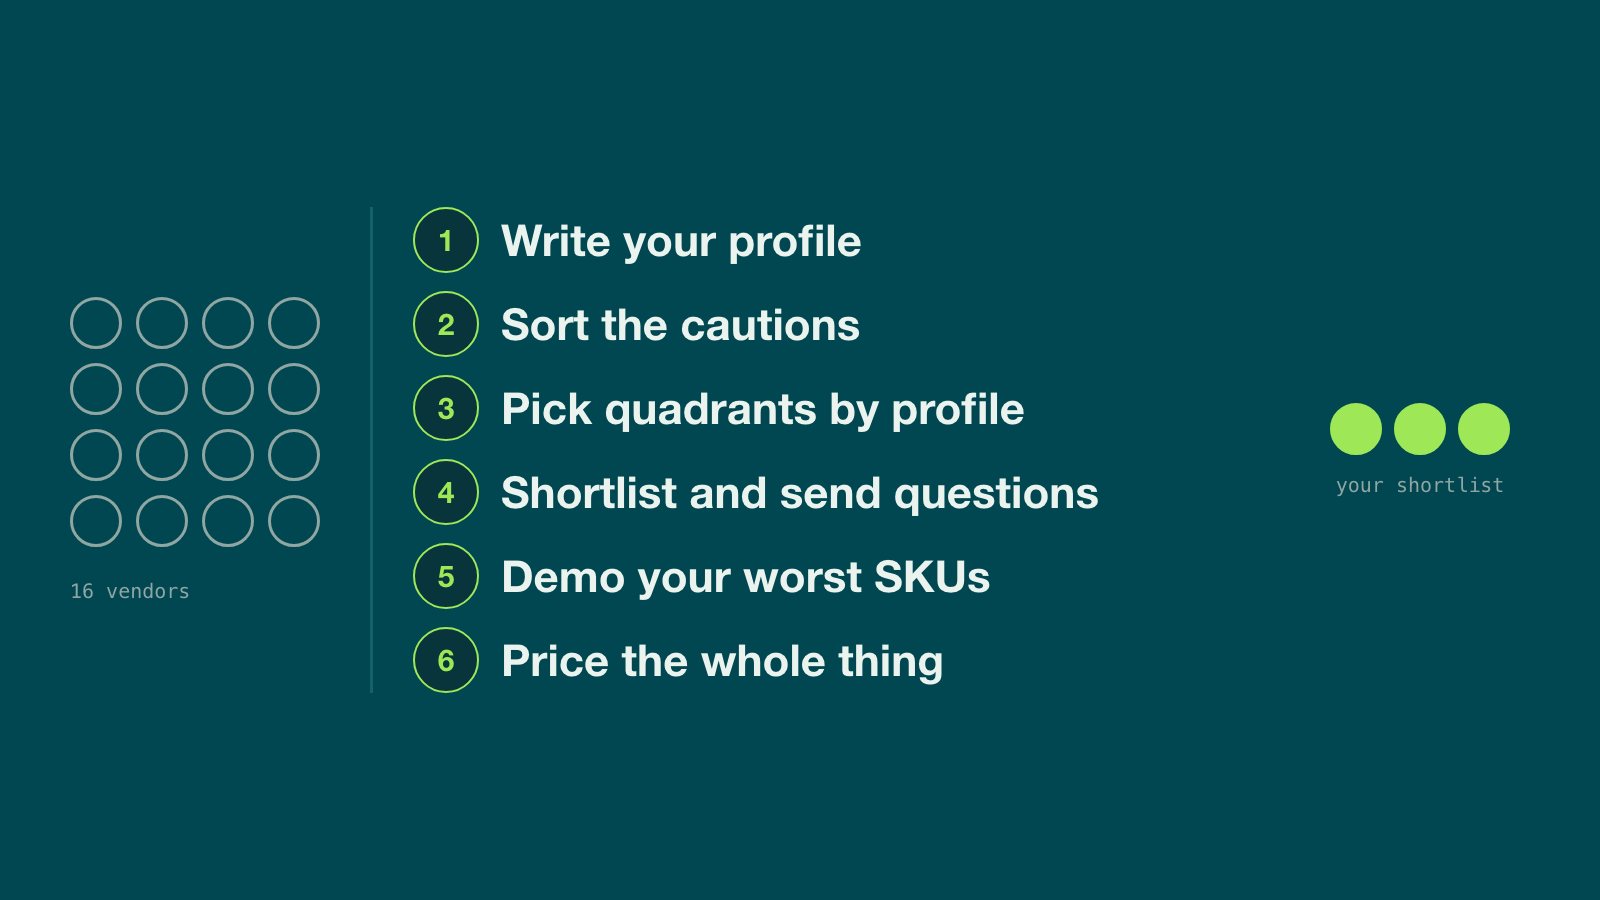
- Write your profile before you open the report. SKU count, number of categories, attributes per category, channels, supplier count, regulatory exposure (DPP, Prop 65, battery rules), and how many people will touch product data. One page.
- Read the cautions before the strengths, and sort them. Each vendor gets three cautions. Tag each one as commercial (pricing, contracts), capability (a gap or roadmap item) or work handed back to you (you build the taxonomy, you map the feeds, you license another tool). By our count, 18 of the 48 cautions in this report fall in that third bucket: the stated remedy is effort by your own team or tools you add.
- Pick quadrants by profile, not by position. Use the table below.
- Shortlist three to five vendors and send real questions. Our PIM RFP checklist has the ones that separate demos from deployments.
- Demo with your own worst SKUs. Bring 50 records straight from a supplier feed, abbreviations and blanks included. Ask the vendor to take one from raw file to complete record on screen, and time it.
- Price the whole thing. Licence, implementation and the labor to fill and maintain the records. That third line is usually the largest, and we break it down in the PIM TCO post.
| Your profile | Quadrant(s) worth a look | What to pressure-test in the demo |
|---|---|---|
| Global enterprise, multiple business units, 250,000+ SKUs | Leaders | Configuration effort for regional regulation; SI hours in the statement of work; time to first live channel |
| Midmarket distributor, 10,000 to 50,000 SKUs, hundreds of supplier feeds | Niche Players, selected Leaders | Whether an industry data model ships or you build it; supplier feed mapping on your files; contract minimums (Gartner flags a 36-month minimum for insightsoftware) |
| Brand syndicating to major retailers | Challenger, Leaders with syndication depth | Retailer connectors you actually need; GDSN data pool access; renewal pricing terms |
| Engineering-led team building a composable stack | Visionaries | API coverage; MCP and agent maturity; whether the AI acts or only recommends |
| EU-exposed manufacturer facing digital product passports | Visionaries, regional Niche Players | Preconfigured DPP templates versus a flexible model you design and maintain |
| Lean team, catalog under 10,000 SKUs | Niche Players | Industry accelerators; manual steps as the catalog grows (Gartner cautions Plytix on this at large sizes) |
If you want a broader starting list outside the report, our guide to choosing a PIM and the best PIM software roundup cover the same ground from the buyer’s side.
The step the report can’t do for you
Once the contract is signed, you own a well-organized system with mostly empty fields. None of Gartner’s 17 features is "complete the product record." Data quality dashboards measure the gap; they do not close it.
So estimate the work before you pick the vendor. The formula is plain:
SKUs × attributes to fill × minutes per attribute = hours of work.
For the 15,000-SKU distributor, assume 20 attributes per SKU still need a value and 1.5 to 2.25 minutes to research and enter each one. That is the 30 to 45 minutes per SKU we see when teams do it by hand.
- 15,000 × 30 minutes = 450,000 minutes = 7,500 hours
- 15,000 × 45 minutes = 675,000 minutes = 11,250 hours
- At roughly 1,800 productive hours per person per year, that is 4.2 to 6.3 people for a full year
That number belongs in the business case next to the licence. It also changes the vendor question. A Leader and a Niche Player will both store those 11,250 hours of output equally well. Neither puts a name next to the hours.
Then decide who does it: your own merchandisers, an offshore team, suppliers through a portal, an AI assistant inside the PIM with a person reviewing each suggestion, or an enrichment layer that owns the work and writes back into whichever PIM you choose. Each has real trade-offs. Make the choice on purpose, not by default after go-live.
Anglera is not a PIM and is not in the report. It sits alongside any of the sixteen and does that filling, extracting each value from supplier documents with a source citation. Your PIM stores the data. Anglera does the work. To see where your own catalog stands before the first demo, grade a product page with the AI readability tool.