
The Scale Aggregators: How 46 Distributors Win on Size
46 distributors compete on national buying power and centralized DCs. Only 14 could be measured for digital readiness — and that gap is the real story.
Part of Top Distributors 2026 — the Anglera Index: North America’s largest distributors ranked, classified into six operating archetypes, and scored on the measured Digital Readiness Index.
McKesson moves roughly a third of all pharmaceutical products consumed in North America through a centralized national network, and it does not do it with a public storefront. That combination — enormous volume, no self-serve catalog — turns out to define the archetype more than any single company does. Forty-six distributors in this index compete primarily on national scale: fewer, bigger distribution centers, purchasing leverage suppliers cannot ignore, and national-account programs built for buyers who operate in every state at once.
The roster
| Rank | Company | Revenue | Digital Readiness |
|---|---|---|---|
| 1 | McKesson Corporation | $359.1B (FY2025) | not measured (no public catalog) |
| 2 | Cencora | $321.3B (FY2025) | not yet measured (catalog verified live) |
| 3 | Cardinal Health | $222.6B (FY2025) | not yet measured (catalog verified live) |
| 4 | Sysco Corporation | $81.4B (FY2025) | not sampled |
| 5 | Performance Food Group | $63.3B (FY2025) | not sampled |
| 6 | McLane Company | $51.0B (FY2025) | not measured (no public catalog) |
| 8 | US Foods | $39.4B (FY2025) | not sampled |
| 9 | United Natural Foods (UNFI) | $31.8B (FY2025) | not sampled |
| 10 | Ferguson | $31.3B (CY2025) | 58 |
| 11 | Arrow Electronics | $30.9B (FY2025) | 49 |
| 13 | Network Distribution | $28B (systemwide, global) (FY2026) | not sampled |
| 14 | Southern Glazer's Wine & Spirits | $25.5B (projected, CY2026) (CY2026, est.) | not sampled |
| 15 | Wesco International | $23.5B (FY2025) | 40 |
| 16 | Gordon Food Service | $23B (FY2024, est.) | 65 |
| 17 | Avnet | $22.2B (FY2025) | 57 |
| 19 | Sonepar (North America) | $19.0B (FY2025, NA) | 62 |
| 20 | W.W. Grainger | $17.9B (FY2025) | 66 |
| 21 | Linde (Americas) | $15.2B (FY2025, segment) | not sampled |
| 23 | Tricon Energy | $14.0B (FY2025, est.) | not sampled |
| 25 | Graybar | $12.9B (FY2025) | 51 |
| 26 | Republic National Distributing Company | $12B (peak, pre-divestiture) (FY2024, est.) | not sampled |
| 27 | Rexel (North America) | $10.1B (FY2025, NA) | not yet measured (catalog verified live) |
| 30 | Dole plc (North America) | $9.17B (FY2025) | 41 |
| 33 | Breakthru Beverage | $8.4B (FY2025) | not yet measured (catalog verified live) |
| 34 | Mansfield Energy | $8.3B (FY2025, est.) | not sampled |
| 37 | Owens & Minor | $8.0B (FY2024, segment) | not sampled |
| 38 | Ben E. Keith Co. | $8.0B (FY2025, est.) | not yet measured (catalog verified live) |
| 39 | Core & Main | $7.65B (FY2025) | 63 |
| 40 | Airgas | $7.5B (FY2024, NA, est.) | 46 |
| 41 | Watsco | $7.24B (FY2025) | 62 |
| 46 | Brenntag North America | $6.5B (FY2025, NA) | not measured (no public catalog) |
| 48 | Boise Cascade (Distribution) | $5.9B (FY2025, segment) | not sampled |
| 53 | Colonial Group | $5.0B (FY2025, est.) | not measured (no public catalog) |
| 56 | Apex Oil | $4.6B (FY2025, est.) | not sampled |
| 62 | Border States | $4.0B+ (FY2024, est.) | not sampled |
| 64 | TTI Inc. | $3.78B (FY2023, dated) | not sampled |
| 69 | BlueLinx Holdings | $3.0B (FY2025) | not sampled |
| 70 | DNOW | $2.8B (FY2025) | not measured (no public catalog) |
| 75 | AmeriGas Propane | $2.28B (FY2025, segment) | not measured (no public catalog) |
| 80 | UFP Industries | $2.00B (FY2025, segment) | not sampled |
| 89 | TricorBraun | $1.4B (stale, FY2020 TTM) (FY2020, dated) | 70 |
| 113 | Moove (North America) | ~$490M (FY2023, NA, est.) | not sampled |
| 120 | WPG Americas | ~$390M (FY2023, NA, est.) | 60 |
| — | Polymershapes | not disclosed | not sampled |
| — | RelaDyne | not disclosed | not sampled |
| — | MRC Global | $3.01B (FY2024) | not yet measured (catalog verified live) |
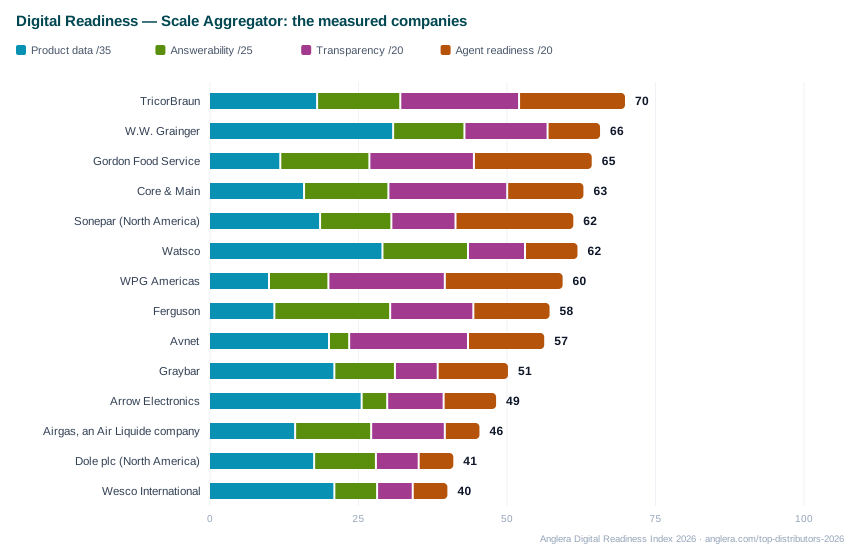
Stacked bars: the four pillars of the Digital Readiness Index — segment lengths are pillar scores, the number is the company's total out of 100.
Median Digital Readiness Index among the 14 companies in this archetype that were measured: 60, against an index-wide median of 58. See the full 2026 index for every archetype.
How the model runs
The mechanics repeat across every vertical in this table. Cencora moves roughly 20% of all pharmaceuticals distributed in the US through about 26 US distribution centers plus nine in Canada — not hundreds of branches, a couple dozen very large hubs. Cardinal Health serves more than 100,000 locations and over 75% of US hospitals, and runs Red Oak Sourcing, a joint generic-drug purchasing venture with CVS billed as the largest generic sourcing operation in the country — buying power turned into a standing structural advantage, not a one-time discount. Arrow Electronics runs over 140 sales facilities but only 39 distribution and value-added centers across 85-plus countries: wide sales footprint, deliberately concentrated inventory footprint. TTI Inc. runs North America out of 13 major DCs holding more than 3 million square feet, and calls its "available-to-sell inventory" the buffer that keeps manufacturers on contract.
Buying power compounds because it funds acquisition, and acquisition adds more buying power. Sonepar closed ten acquisitions in 2025 adding $277 million in revenue, posted record global sales of $37.9 billion, and grew digital sales 50% to $13.9 billion through its Spark platform, all while acquired regional brands keep operating under their own names. Graybar is mid-way through roughly its twentieth acquisition in a decade, layering new STAR distribution centers built for data-center and large-construction accounts on top of a long-standing branch network. Sysco put the mechanic on full display in March 2026, agreeing to acquire Jetro Restaurant Depot for roughly $29.1 billion enterprise value — its largest deal ever — funded by a company that already runs 337 distribution centers serving about 730,000 customer locations. The clearest evidence of what that scale is worth: Border States left the Affiliated Distributors buying group in December 2025, after 40 years, to negotiate with suppliers directly. A company has to already move roughly $4 billion a year on its own before that trade makes sense.
None of this runs through a shopping cart. National accounts are negotiated relationships — EDI feeds, punchout catalogs, dedicated reps, contract pricing — not browse-and-buy web storefronts, and the data reflects that structure directly. Six of the 46 companies here are coded "no public catalog": a corporate site that is pure brochureware sitting in front of a login-gated ordering portal. Six more carried that code until an adversarial verification pass turned up live public product pages — usually on an owned banner storefront, like Cencora's ASD Healthcare or Cardinal Health's Canadian shop — and now read "catalog verified live," unscored until a rule-compliant sample is taken. Another chunk simply weren't in the sampled panel. Fourteen had a public catalog that was actually measured.
The tension: scale is rented, not owned
The archetype description calls out the risk plainly — big enough to be slow, not local enough to be fast — but the data points to a sharper version of the trade-off. National scale in distribution is built on supplier relationships that suppliers can walk away from. Republic National Distributing Company assembled national breadth across roughly 40 states by merging four family beverage businesses into the #2 US wine-and-spirits distributor. When major suppliers including Brown-Forman and Tito's pulled their brands, RNDC exited California, sold operations in 11 states plus DC to Reyes Beverage Group, agreed to sell its remaining control-state operations to Martignetti Companies, and filed for Chapter 11 on July 26, 2026. The scale that made RNDC valuable was never fully its own; it was rented from the brands that chose to route volume through it, and the rent can be revoked.
Scale is also hard to consummate even when both sides want it. Performance Food Group's proposed merger with US Foods — a deal that would have leapfrogged Sysco outright — collapsed in early 2026. PFG says it is now hunting for acquisitions with an expanded war chest instead, which is itself telling: when the single biggest possible scale move fails, the fallback is the same bolt-on playbook every other company in this table already runs.
What the index says about this model
Read the roster and a pattern jumps out before you even get to scores: the largest company in the entire 2026 index by revenue, McKesson at $359.1 billion, is coded "no public catalog," and so is McLane at $51.0 billion. Cencora at $321.3 billion and Cardinal Health at $222.6 billion carried the same code until verification found live product pages on owned banners — ASD Healthcare and Cardinal's Canadian storefront — leaving them catalog-verified but unscored this edition. That is close to definitional, not a sampling accident. The model's actual selling motion runs through negotiated national-account channels, not open web catalogs, so the mechanism that makes a company big enough to top this list is the same mechanism that keeps its product data invisible to a public crawl. A gated portal is not a failing grade here; per the methodology, it is simply unscored — a finding about the channel, not a verdict on the business.
That leaves a smaller and more mid-scale group actually measured — fourteen companies, from WPG Americas at roughly $390 million up to Ferguson at $31.3 billion — and within that group the scores still edge ahead: a median of 60 against an index-wide median of 58. With only fourteen data points and a two-point gap this should be read as a plausible pattern, not a proven one, but there's a structural reason it would hold: companies in this archetype that still run an open storefront generally do so because they also serve smaller accounts who won't set up EDI, and that self-serve motion forces real investment in the page.
The pillar breakdown carries the real texture. Grainger posts the group's best product-data score, 31 of 35, with a median of 47 attributes per sampled page — then scores just 9 of 20 on machine and agent readiness, because its robots policy explicitly blocks AI crawlers. Best data, worst access, same company. Watsco matches Grainger's 47-attribute median but posts the widest consistency spread in the group, 29 points between its richest and thinnest page — a direct readout of a company built through more than 70 acquisitions that deliberately keeps each acquired banner's identity intact; the sample was drawn from Carrier Enterprise, one of several distinct operating companies under the Watsco roof, because no single unified catalog exists to sample instead. Ferguson is the inverse puzzle: a respectable 58 overall and the group's best buyer-answerability score, 19.5 of 25, alongside a median of zero structured attributes — pages that read well to a person and hand a crawler almost nothing to parse. TricorBraun posts the group's high score, 70, with full public pricing, a working sitemap, product structured data, and the only "partial" AI-crawler stance in the set, where every other measured company here either blocks AI crawlers outright or leaves the question unaddressed.
The read
Scale aggregation is a supplier-facing strategy first and a buyer-facing one second, and the digital-readiness data is a direct consequence of that ordering. The companies that dominate this table by revenue built their advantage in purchasing offices and distribution-center footprints, not on product pages, and most of them don't run a page a stranger could browse at all. The ones that do — mid-scale by comparison, still billion-dollar businesses — treat the storefront as one more channel to manage well, and on the numbers they generally do. The interesting question for this archetype isn't which company has the best catalog. It's how much of the industry's actual volume never touches a catalog at all.